Manage your portfolio
like a pro.
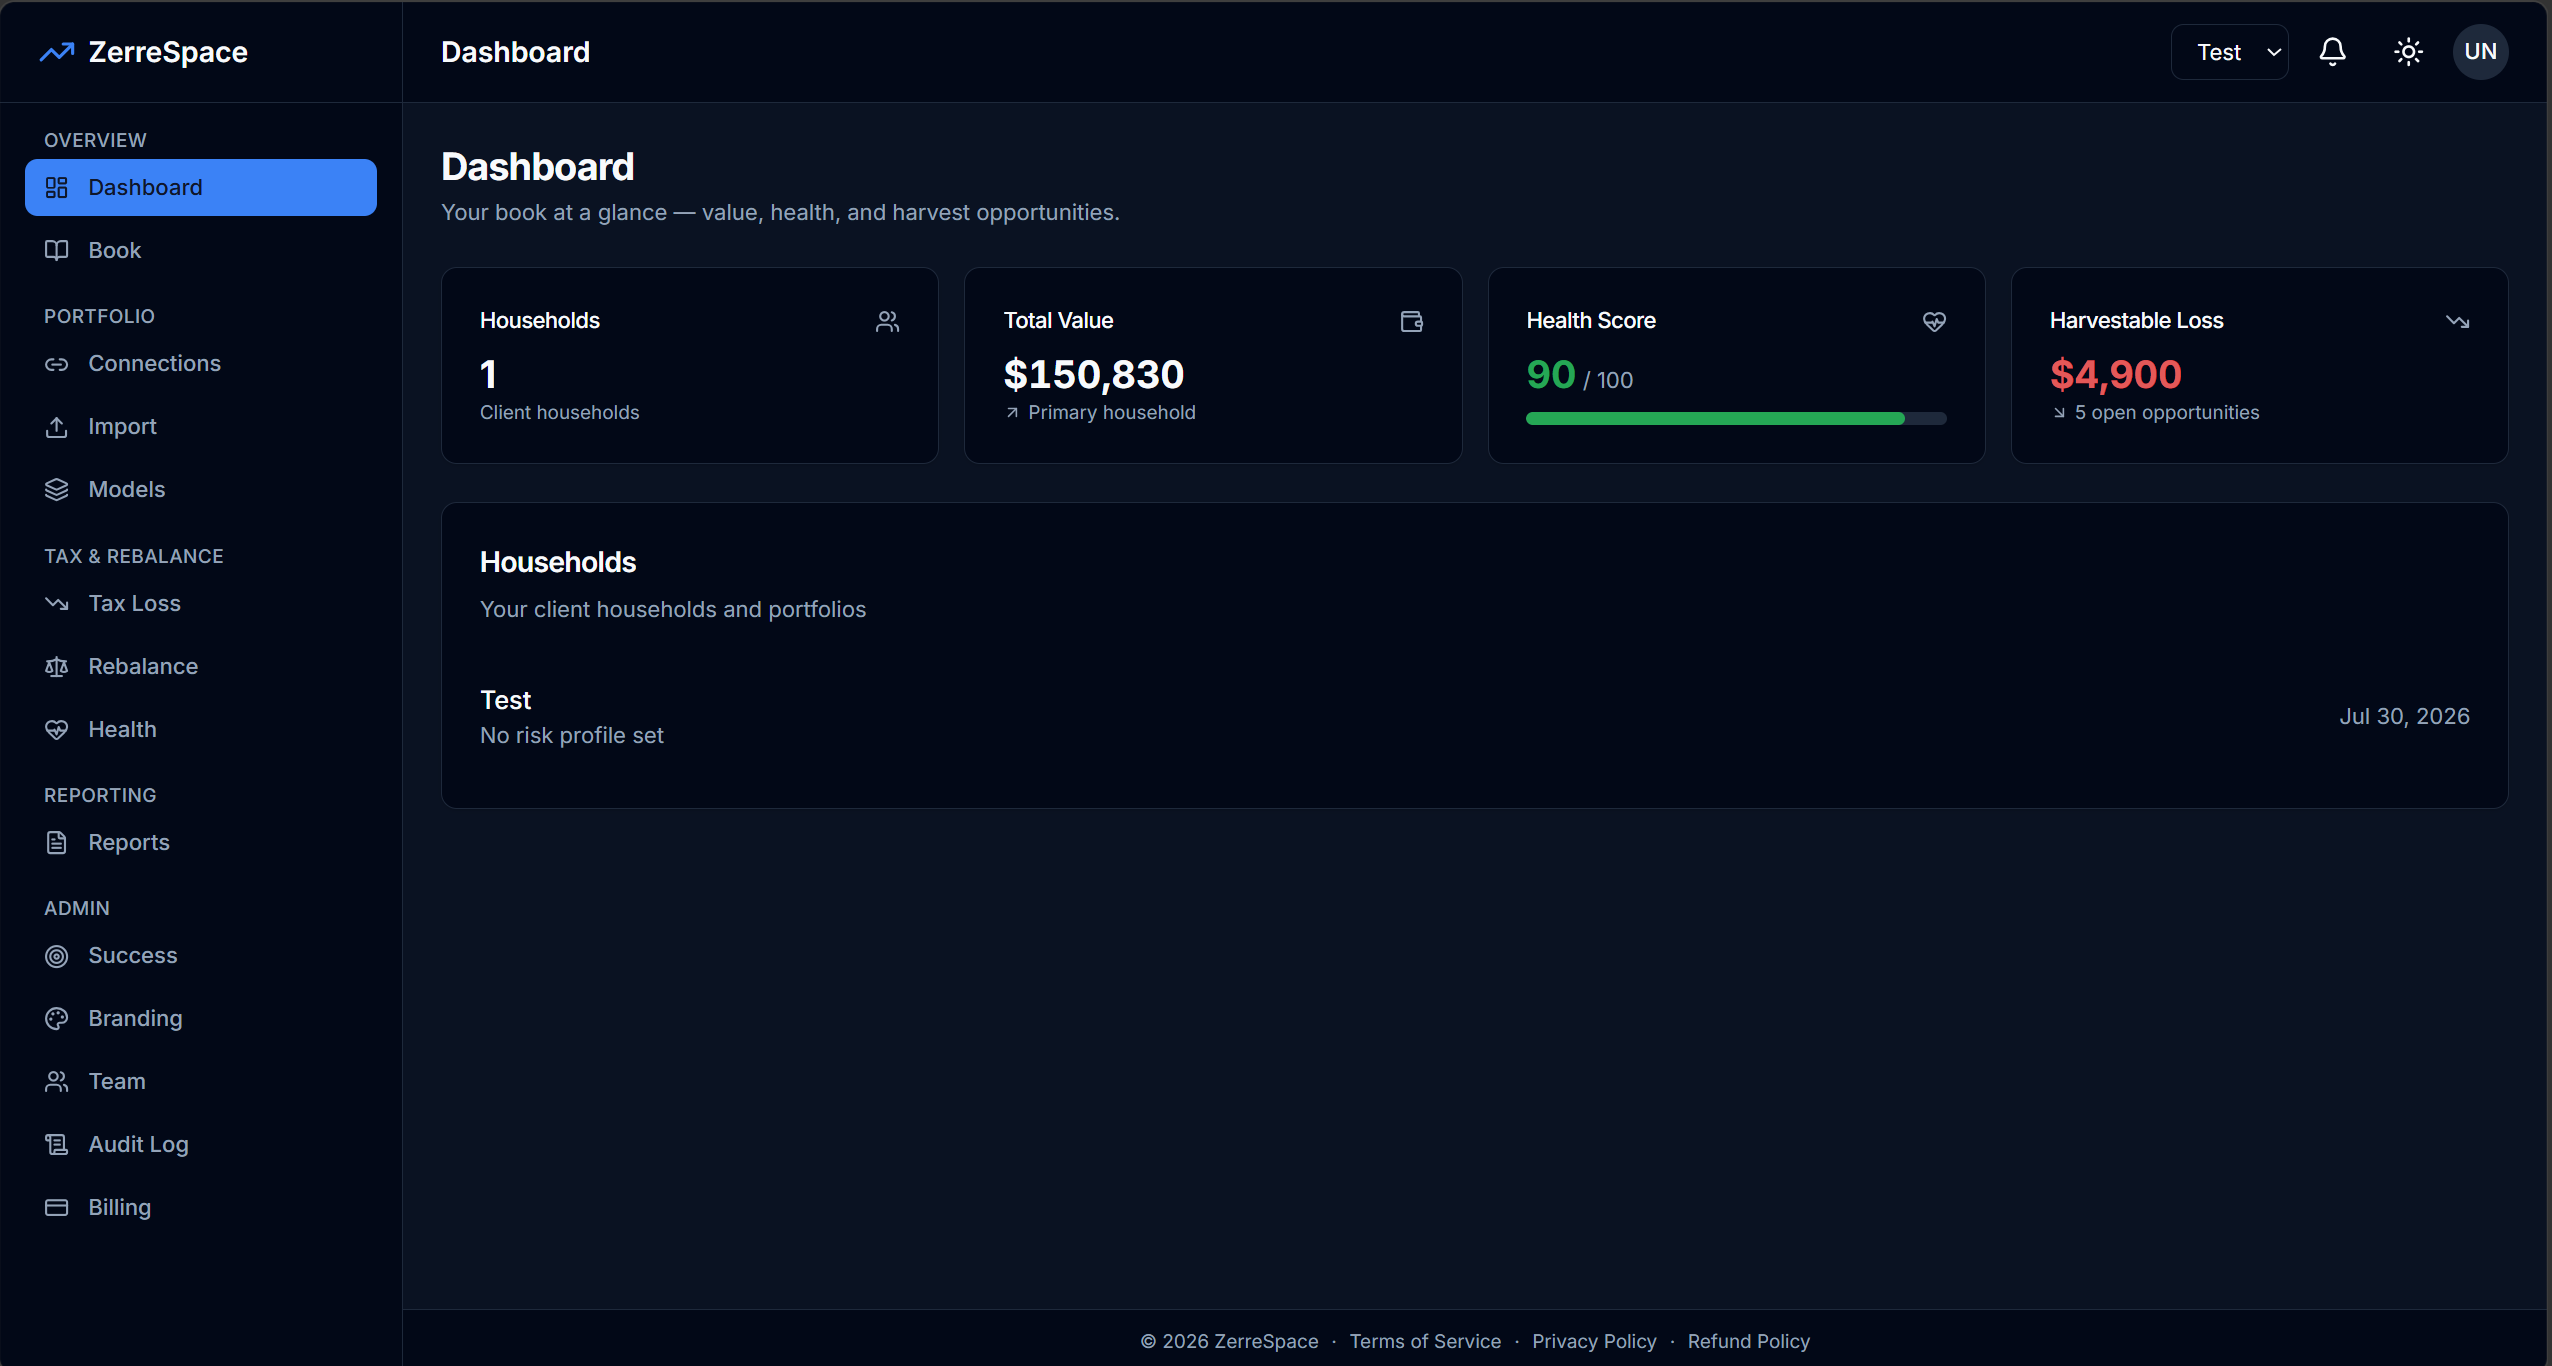
ZerreSpace finds tax-loss harvesting opportunities, scores your portfolio's health, generates tax-aware rebalancing plans — and explains every number in plain English. One engine for serious individual investors, advisors and teams.
No credit card required · Free plan forever
Everything in one place
Built for how you actually invest
From a single click to full multi-account oversight.
AI explanations
Every number — explained in plain English. The math is deterministic; the AI only narrates, and a validator guarantees it never invents a figure.
Tax-loss harvesting
Ranked harvest opportunities with a wash-sale check, replacement suggestions and estimated tax benefit — before year end.
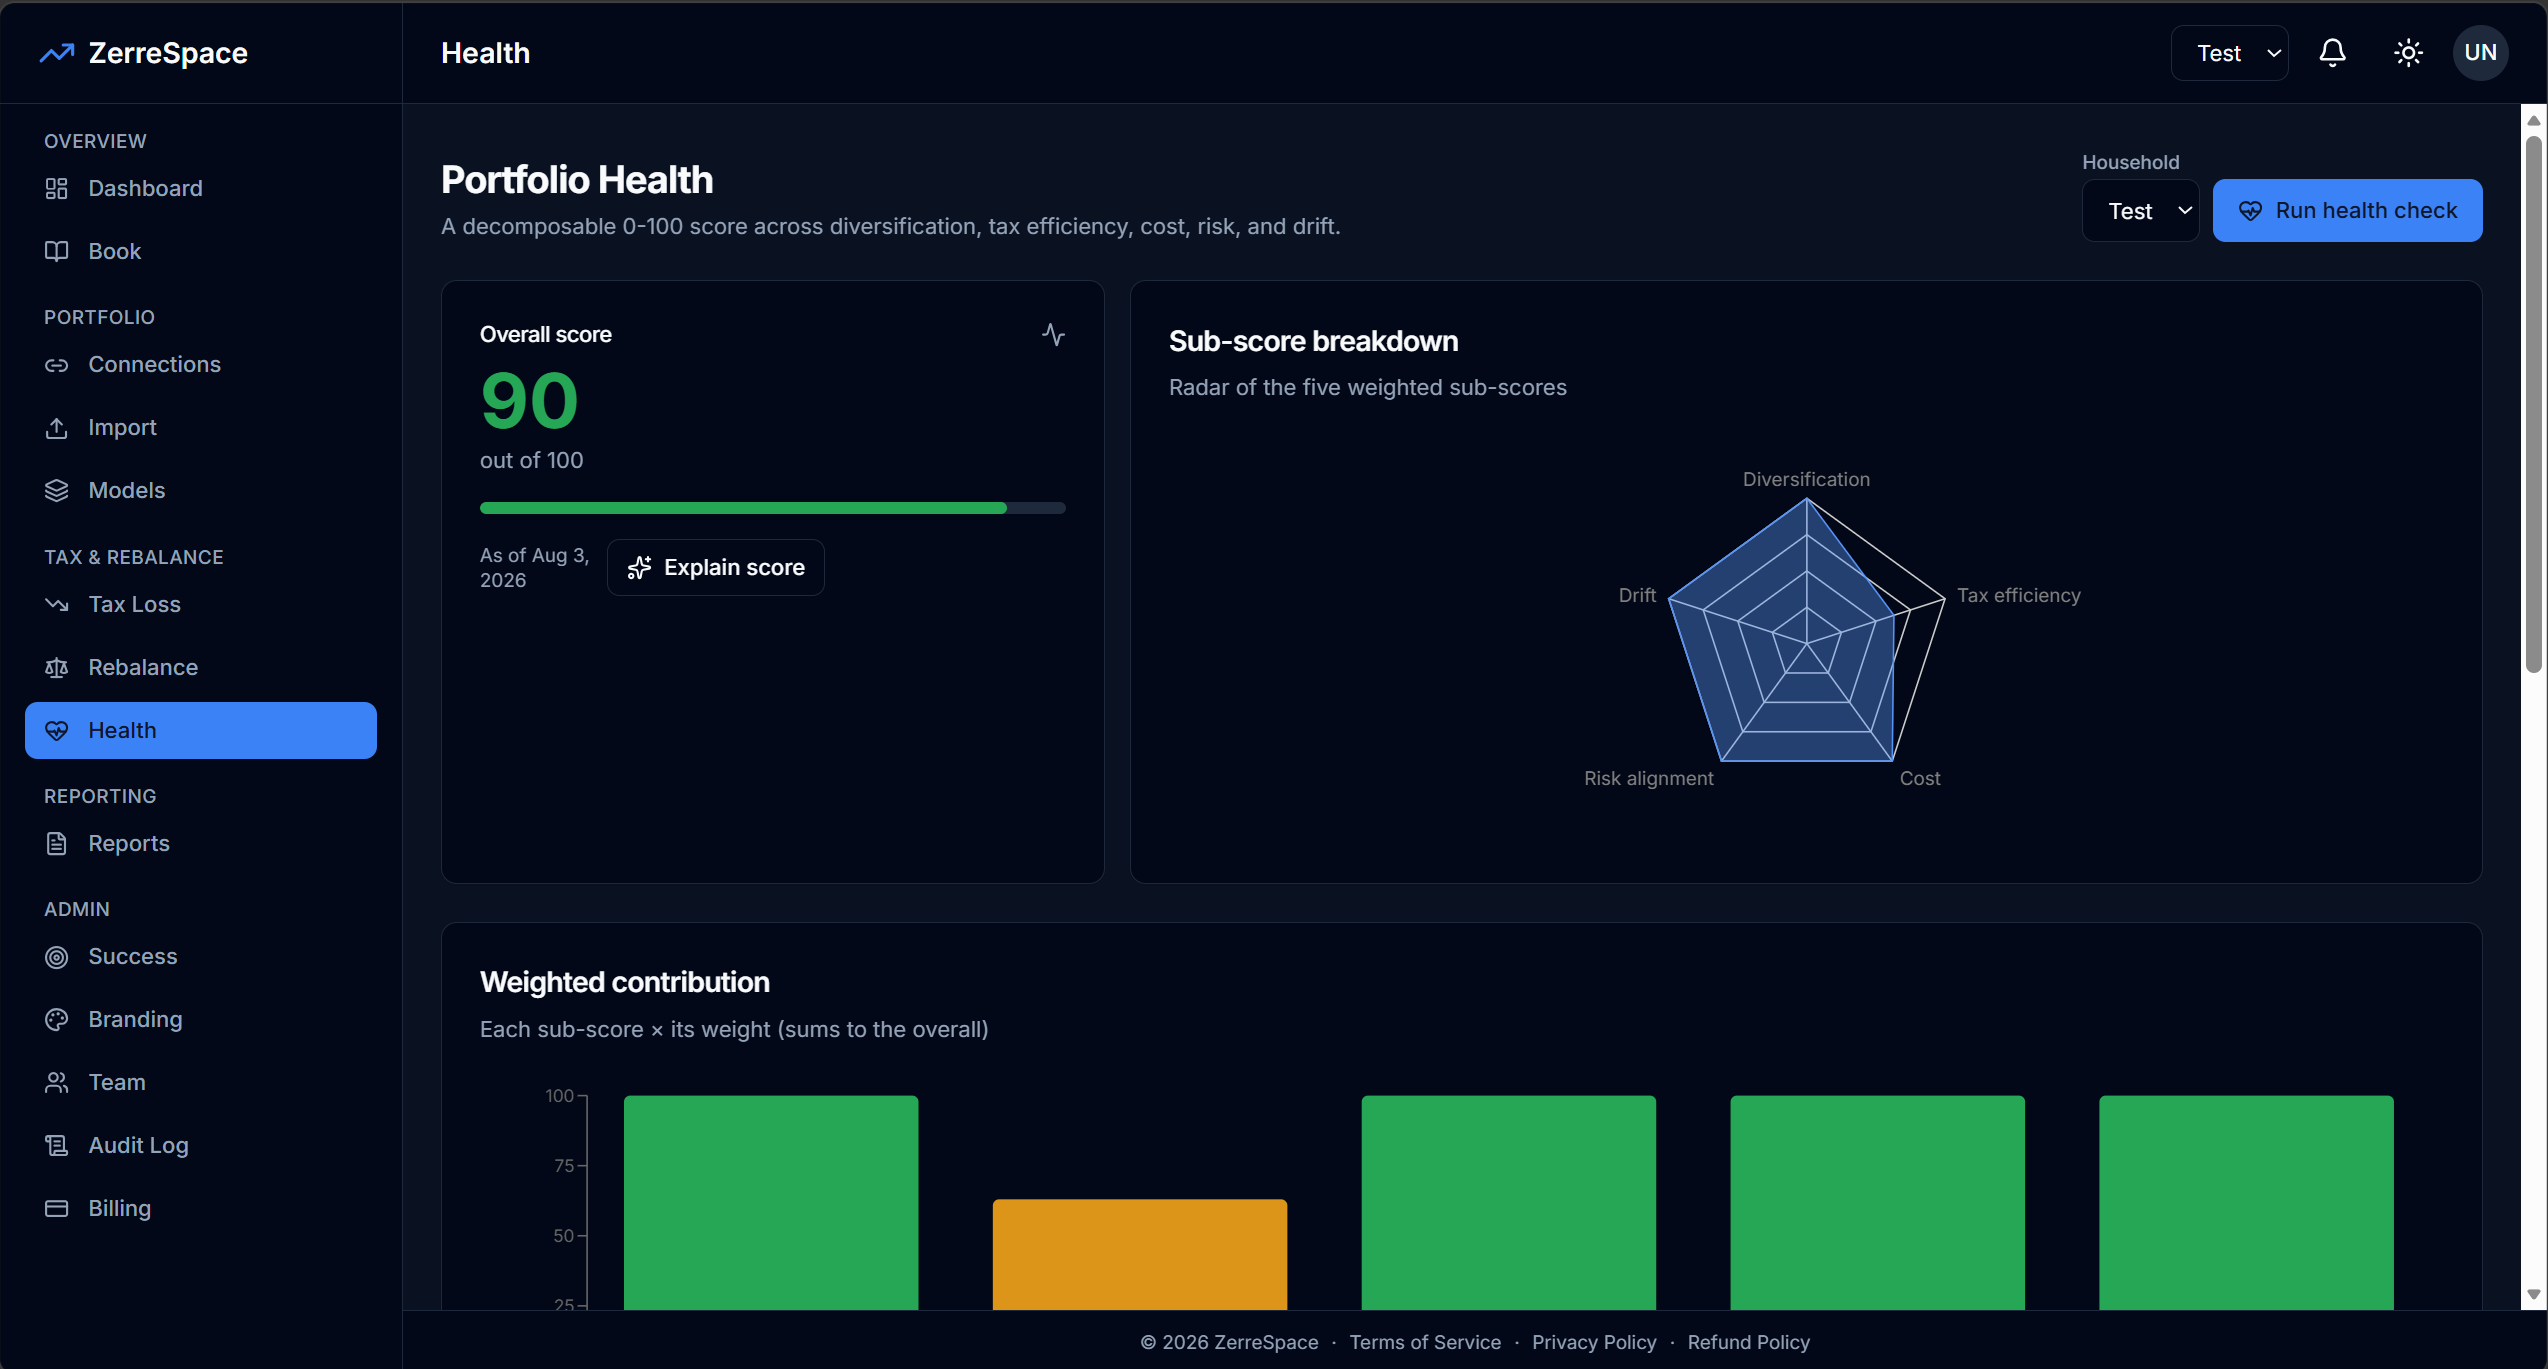
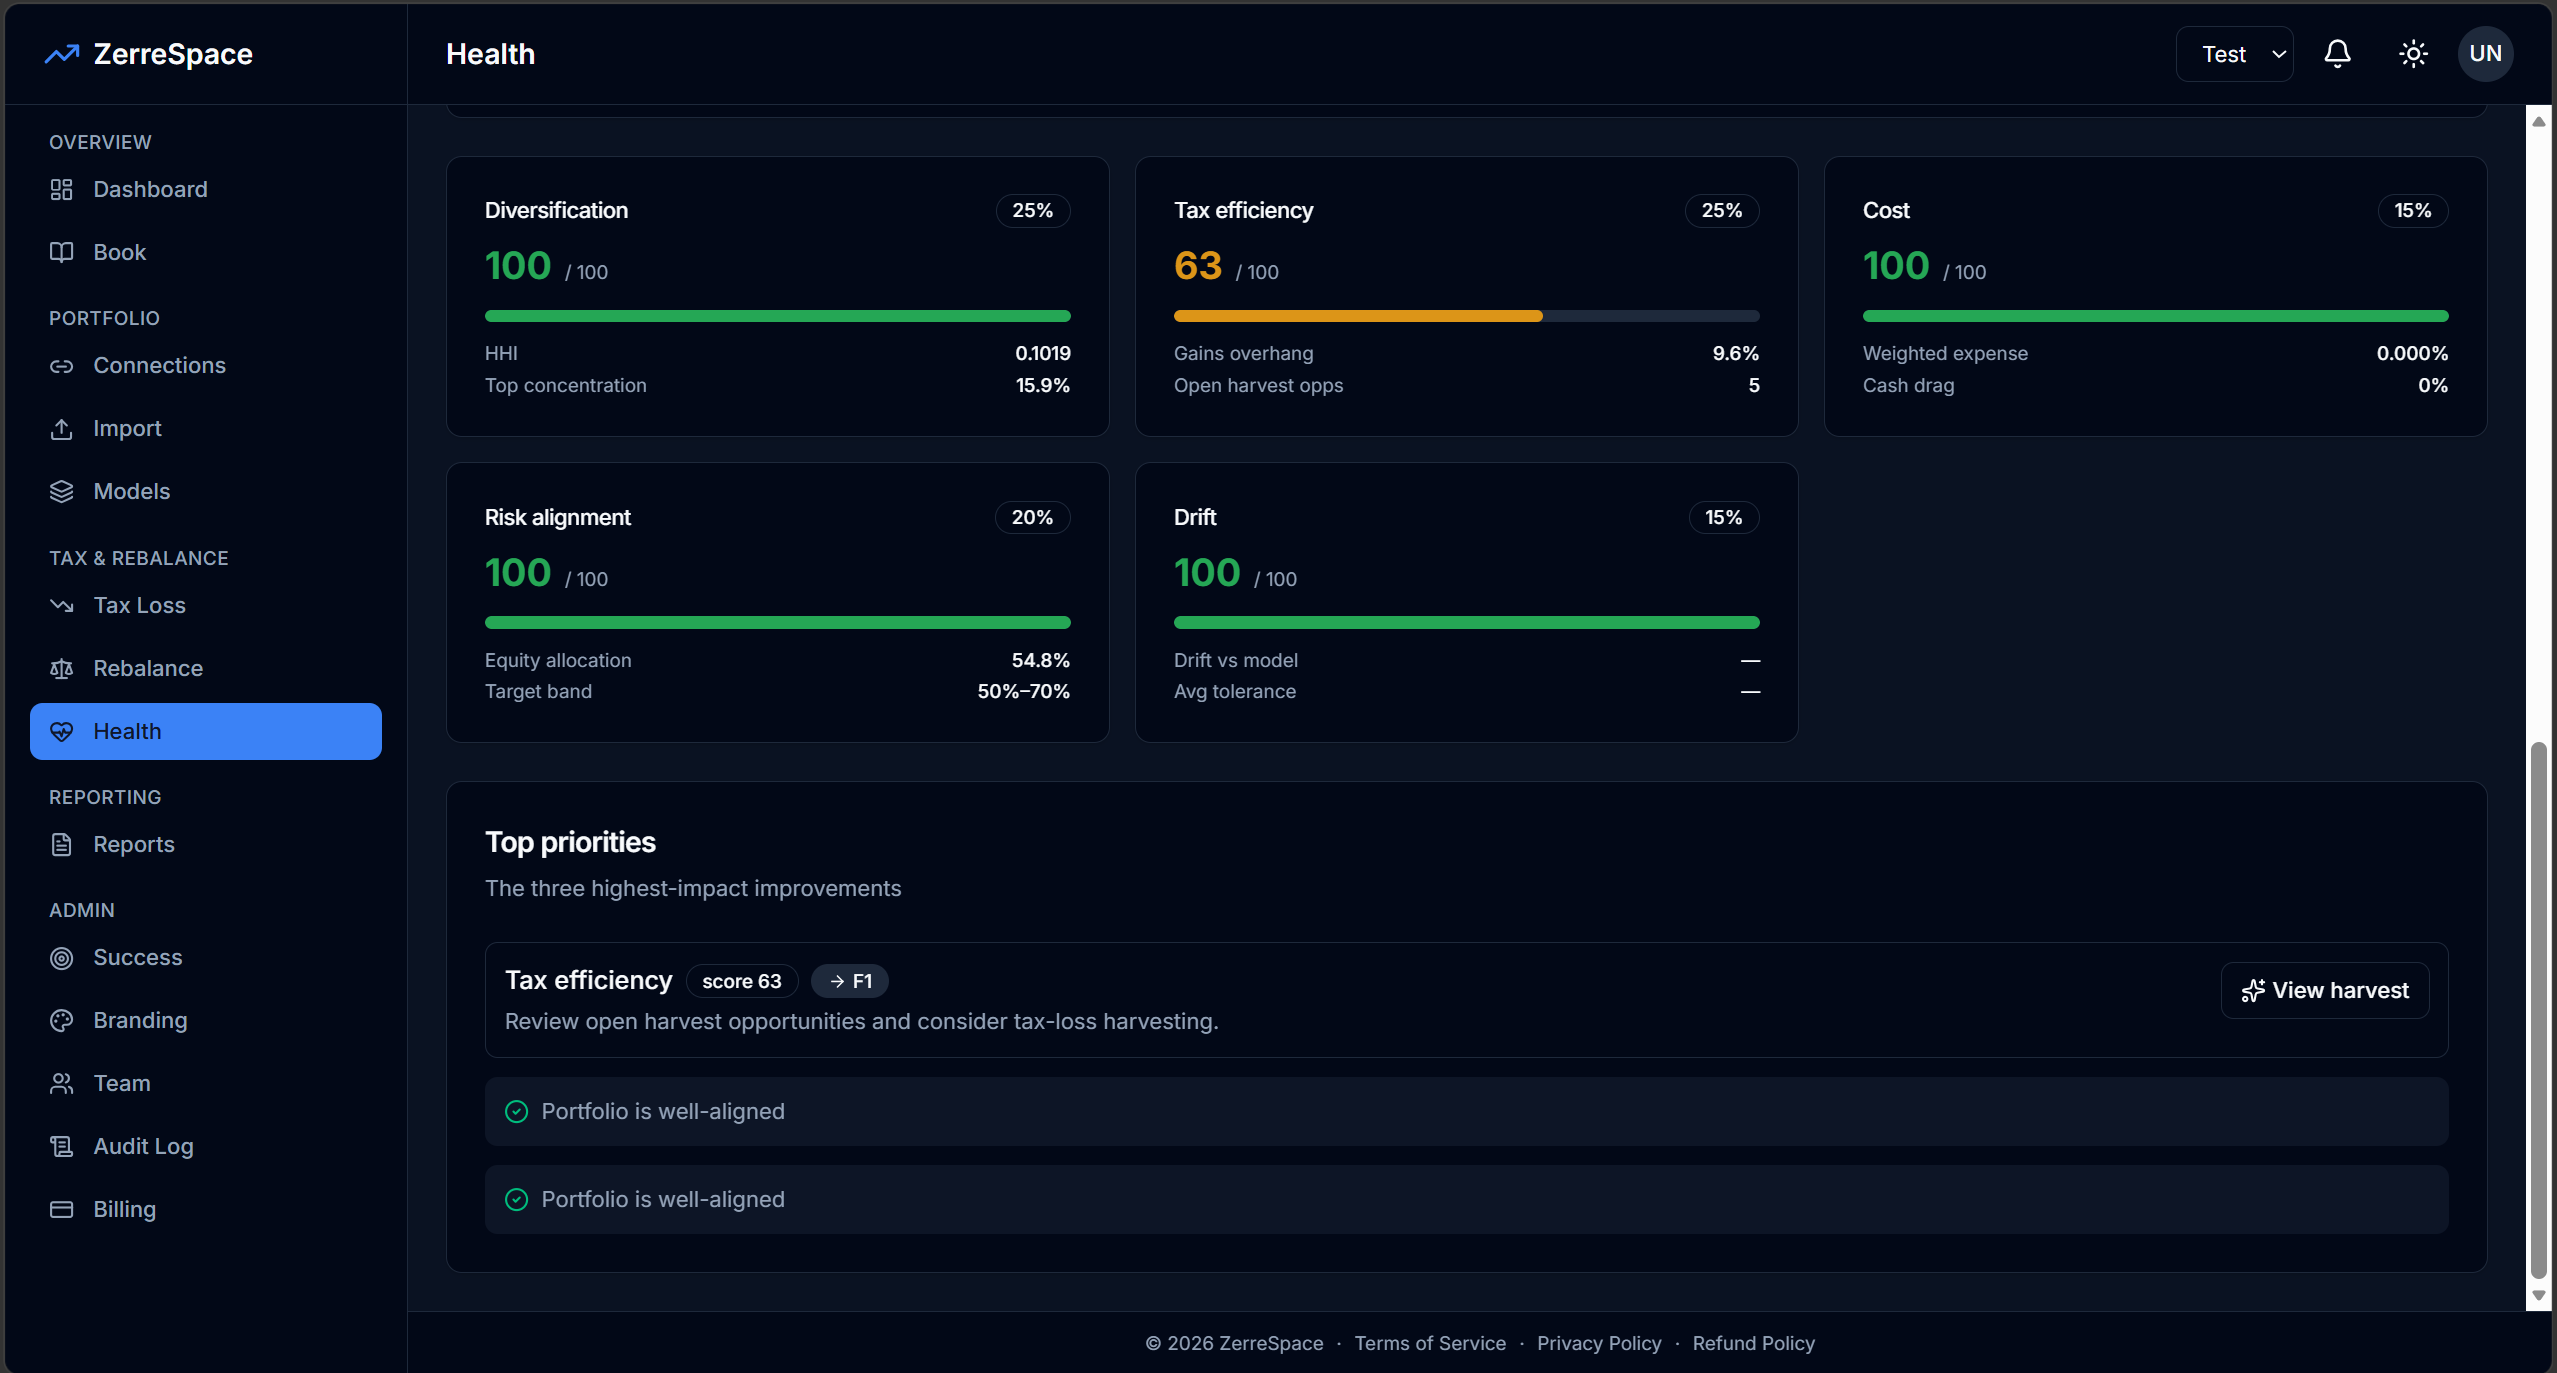
Portfolio health score
A decomposable 0–100 score across diversification, tax efficiency, cost, risk and drift — with your top three fixes ranked.
Tax-aware rebalancing
Generate a tax-aware trade plan against your target model with drift and tax impact shown up front. You review and export — nothing is executed.
Model portfolios
Build target models and assign them across every household you manage, so rebalancing always has a benchmark.
CSV import
Bring in holdings, lots and transactions from any broker with a quick CSV import — no manual data entry. Direct broker sync is coming.
Advisor book & teams
Manage many client households, scan the whole book for harvest opportunities, and invite teammates with role-based access and a full audit log.
White-label reports
Generate polished PDF reports — allocation, tax activity and health — with your own branding for client-ready deliverables.
One product, two ways to work
Whether it's your money or your clients'
For individual investors
Keep every account on target without a spreadsheet.
- ✓ Track and rebalance all your accounts in one view
- ✓ Tax-aware trade plans before you buy or sell
- ✓ Start on the free plan, upgrade when you need more
For advisors & teams
Manage many client portfolios with control and audit trails.
- ✓ Per-seat team billing with role-based access
- ✓ Your own branding on client-facing reports
- ✓ Full audit log of every change and action
Pricing
Simple plans that grow with you
Start free. Upgrade any time. Cancel any time.
For individuals
Free
$0
To get started
- ✓ 1 household (portfolio)
- ✓ Health score & CSV import
- ✓ 10 AI explanations / mo
Plus
$12/mo
For active investors
- ✓ 1 household · unlimited linked accounts
- ✓ Tax-loss harvesting, tax-aware rebalancing & asset location
- ✓ 100 AI explanations / mo
Premium
$29/mo
For heavy AI use
- ✓ Everything in Plus
- ✓ 300 AI explanations / mo — 3× Plus
- ✓ The difference is AI volume, not features
For advisors & teams
Solo
$99/mo
For independent advisors
- ✓ Up to 75 client households
- ✓ Everything in Premium
- ✓ Branding & PDF reports
- ✓ Audit log · 1,000 AI expl. / mo
Team
$149/seat/mo
For firms · minimum 3 seats
- ✓ Up to 150 households / seat
- ✓ Model portfolios & white-label
- ✓ Role-based access & invites
- ✓ 1,500 AI expl. / seat / mo
Prices in USD; taxes may apply at checkout. AI-explanation quotas are per month (cached explanations are free and don't count); extra explanations are available as add-on packs. Accounts within a household are uncapped.
CSV import
Bringing your portfolio in
Upload one of three CSV shapes. The importer detects which one you sent from the header row — so use these exact column names. Dates are YYYY-MM-DD.
1 · Holdings
Current positions — the simplest startOne row per position you hold today.
Columns: symbol, quantity, market_value, cost_basis, as_of
symbol,quantity,market_value,cost_basis,as_of
VTI,280,58800.00,50550.00,2026-06-28
VXUS,180,10260.00,12560.00,2026-06-28
BND,300,24150.00,24900.00,2026-06-28
2 · Tax lots
Best tax accuracyOne row per lot (a purchase at a given date/price). Powers lot-level harvesting and wash-sale checks.
Columns: symbol, quantity, acquired_at, cost_per_share, cost_basis, external_id
symbol,quantity,acquired_at,cost_per_share,cost_basis,external_id
VTI,100,2023-03-15,165.00,16500.00,lot-vti-001
VTI,150,2024-11-20,190.00,28500.00,lot-vti-002
VTI,30,2025-09-18,185.00,5550.00,lot-vti-003
3 · Transactions
Full trade historyOne row per trade. type is buy, sell, dividend, etc.
Columns: symbol, type, quantity, price, amount, trade_date, external_id
symbol,type,quantity,price,amount,trade_date,external_id
VTI,buy,100,165.00,16500.00,2023-03-15,txn-001
AAPL,buy,60,165.00,9900.00,2023-06-01,txn-002
VXUS,buy,80,72.00,5760.00,2023-09-10,txn-003
Good to know
- ✓ Matching is by header name, not position — column order is flexible, but the names must be exactly as shown.
- ✓ Any shape may add an optional asset_class column (e.g. equity, bond). Left out, symbols are auto-classified.
- ✓ Dates use YYYY-MM-DD. Money is a plain number (no currency symbol or thousands separators).
- ✓ external_id is your own unique id per row — re-importing the same file updates rather than duplicates.
Start managing smarter today
Join in minutes on the free plan. No credit card, no commitment.
Start free